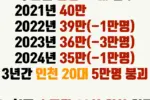
이미지 텍스트 확인
Figure 2,2. The labour force will shrink and the old-age dependency ratio surge at an
unprecedented pace
A Population pyramids
2000
2023
2050
Women
70-74
65 69
Men
60-64
55-59
50-51
45 49
40 4
35-39
J0-34
25-29
20-24
‘5.19
1 2
16 14 12 10 8
0 2 4
10 12 14 16
Perceniaga of populabon
Percentage olpopulabon
Petcentage oT population
Million
B Population and employment projections
Old-age dependency ratio
Popuaton
2082
02023
110
Empoymani
20DD
2010
2020
203)
Z040
Z05D
ZGD
Z07O
Z080
Z0g0
2100
표정중로렉훌중품돌로등쓸동 표교로표로중균용즈염록호
Note: Panels
and B assume that employment rates by age group; the total fertility rate (0.7) net immigration inflows (30,000 per year); an
employment rates by gender
five-year age cOhorts all remain COnstant at current levels Panel C assumes that the total fertility rate in
countries eventually converges t0 1.85 children per woman,
a medium-variant forecast from the United Nations’ World Population Prospect
2022 The old-age dependency ratiois defined as the ratio of individuals aged 65 and over to those aged 20 t0 64.
Source: OECD Economic Surveys: Korea 2024.
Years
and
2050
이미지 텍스트 확인
16 14 12 10 8
6
4
2 0 2 4
6
8 10 12 14 16
Percentage Of population
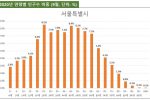
역피라미드형도 아니고 허수아비형이네